Commits - Per Day:
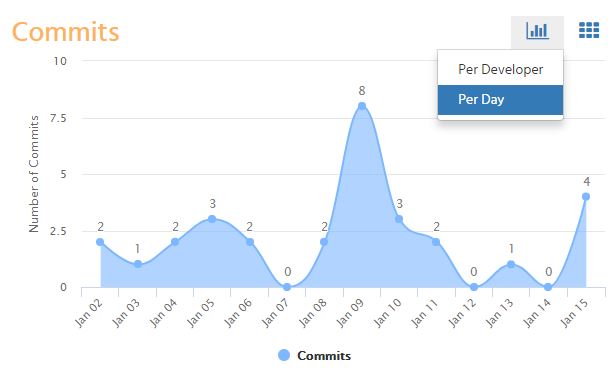
Clicking on the  icon on the right, pull down and select the per day choice.
This will show the commits per day chart constructed from commits
and pull requestsfrom all the mapped git repositories.
The X-Axis tracks the time span of the active sprint or the last 30 days if there is no active sprint.
The Y-Axis tracks the number of commits.
| Panel | ||||||||||||
|---|---|---|---|---|---|---|---|---|---|---|---|---|
| ||||||||||||
Commits chart grid viewCommits per developerPull requests per developerPull requests per dayPull requests grid viewSetup Bitbucket views |
| Panel | ||||||||||||
|---|---|---|---|---|---|---|---|---|---|---|---|---|
| ||||||||||||
The At A Glance Atlassian Community is here for you.Ask the community |
| Panel | ||||||||||||
|---|---|---|---|---|---|---|---|---|---|---|---|---|
| ||||||||||||
Open a support ticket |