Pull Requests - Per Day:
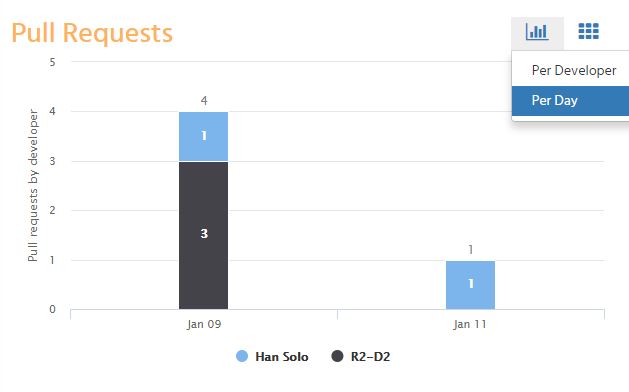
Clicking on the  icon on the right, pull down and select the per day choice.
This will show the Pull Requests per day chart constructed from pull requests from all the mapped git repositories.
The X-Axis tracks the time span of the active sprint or the last 30 days if there is no active sprint.
The Y-Axis tracks the number of pull requests.
Clicking on legends representing the developers, will hide / show the bars on the chart.
| Panel | ||||||||||||
|---|---|---|---|---|---|---|---|---|---|---|---|---|
| ||||||||||||
Setting up Jira SoftwareStart a software projectSet up your software team |
| Panel | ||||||||||||
|---|---|---|---|---|---|---|---|---|---|---|---|---|
| ||||||||||||
The At A Glance Atlassian Community is here for you.Ask the community |
| Panel | ||||||||||||
|---|---|---|---|---|---|---|---|---|---|---|---|---|
| ||||||||||||
Open a support ticket |