Sonar Get to the trends page by clicking on the
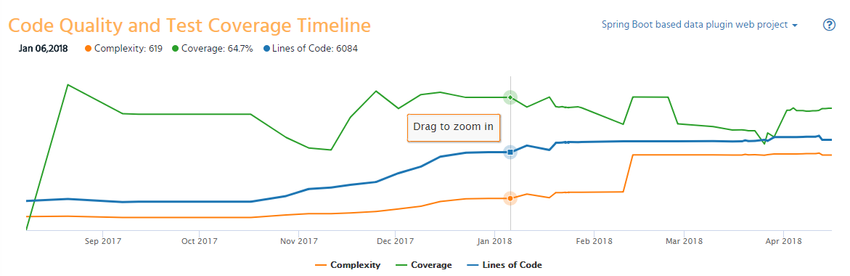
Code Quality and Test Coverage Timeline:
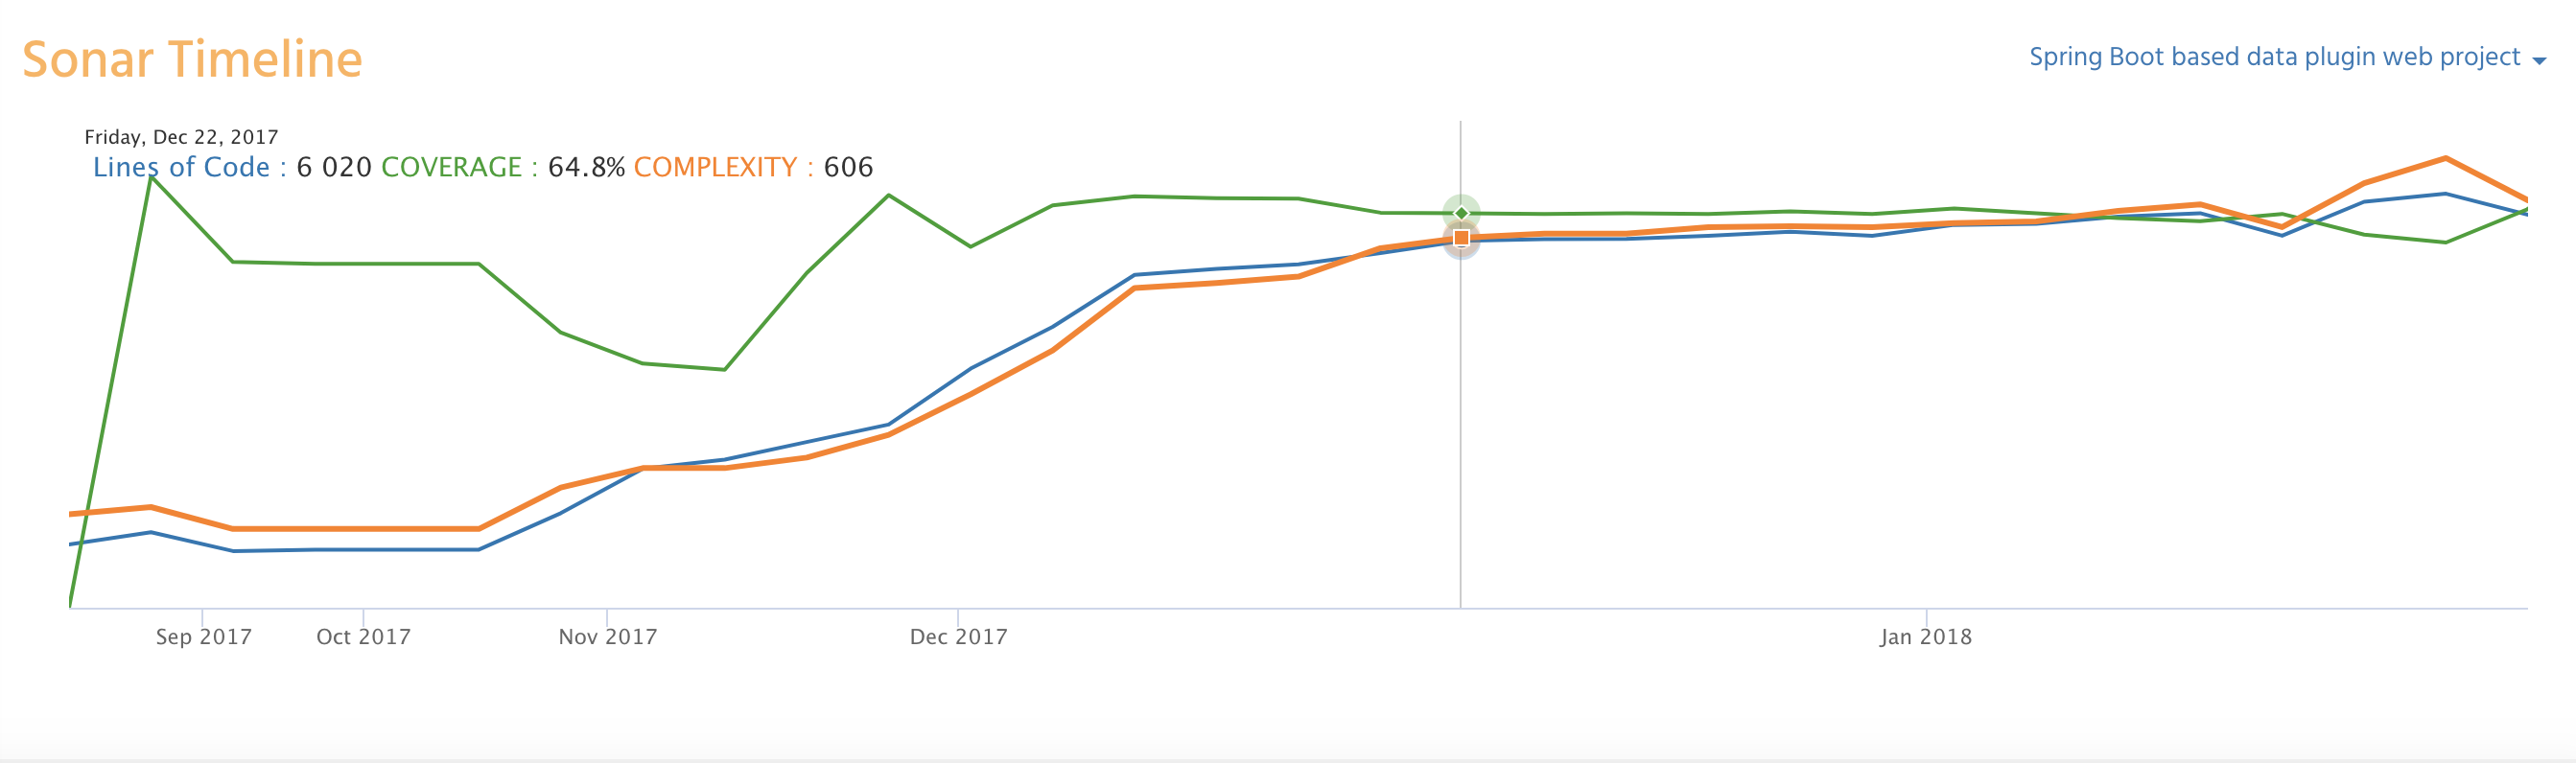
Get to the trends page by clicking on the  on the left hand bar. Sonar Timeline chart displays the trend of the change in lines of code, test coverage and code complexity over a period of time.
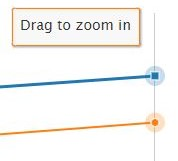
Hover over the chart to view the values of the 3 metrics on that specific date. The horizontal line on the chart displays the values as of date. You can also zoom in a particular area by clicking on 'Drag to zoom in' and dragging the expected zoom area.
Reset zoom by clicking 'Reset zoom' on the chart.
| Panel | ||||||||||||
|---|---|---|---|---|---|---|---|---|---|---|---|---|
| ||||||||||||
Setting up Jira SoftwareStart a software projectSet up your software team |
| Panel | ||||||||||||
|---|---|---|---|---|---|---|---|---|---|---|---|---|
| ||||||||||||
The At A Glance Atlassian Community is here for you.Ask the community |
| Panel | ||||||||||||
|---|---|---|---|---|---|---|---|---|---|---|---|---|
| ||||||||||||
Open a support ticket |