Stories and Bugs:
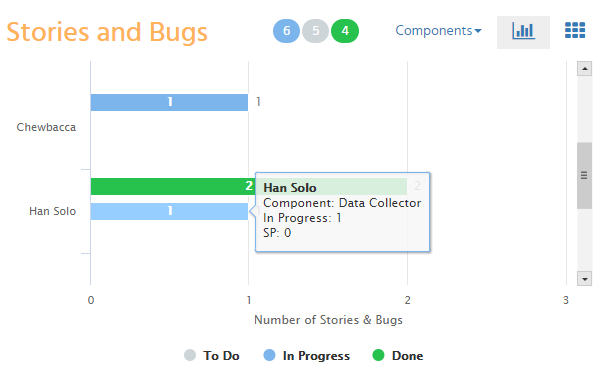
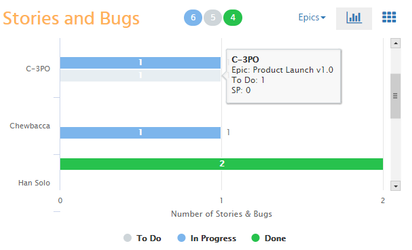
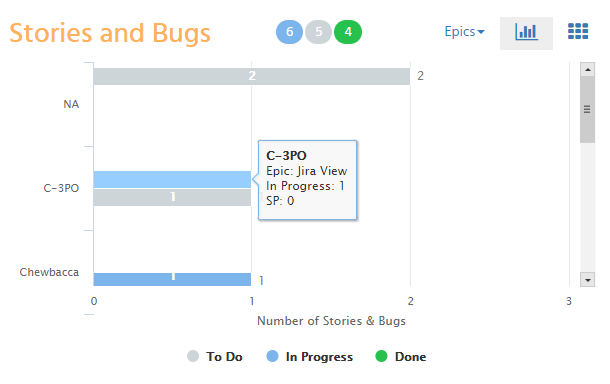
Click  icon on the Stories and Bugs widget to view the chart by developer (assignee) on Y axis and number of stories and bugs on X axis. Based on the user selection of 'Epics' or 'Components', the chart displays the bars the number of stories assigned per epic or component. Different colors on bars denote the status of the stories and bugs.
Hover over each bar to view the Developer name, Epic / Component name, total number of stories and sum of story points in that status.
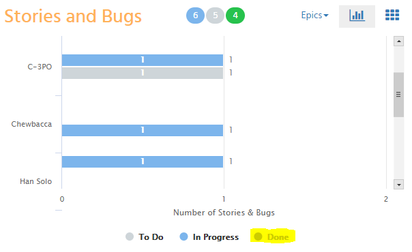
Clicking on legends representing the status of the stories, will hide / show the bars on the chart.
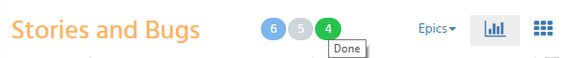
The widget also displays the total number of issues in 'To Do', 'In Progress', 'Done' statuses. Hover over the circles to view the status.
| Panel | ||||||||||||
|---|---|---|---|---|---|---|---|---|---|---|---|---|
| ||||||||||||
Setting up Jira SoftwareStart a software projectSet up your software team |
| Panel | ||||||||||||
|---|---|---|---|---|---|---|---|---|---|---|---|---|
| ||||||||||||
The At A Glance Atlassian Community is here for you.Ask the community |
| Panel | ||||||||||||
|---|---|---|---|---|---|---|---|---|---|---|---|---|
| ||||||||||||
Open a support ticket |
Stories and Bugs - Epics:
Stories and Bugs - Components: