Commits:
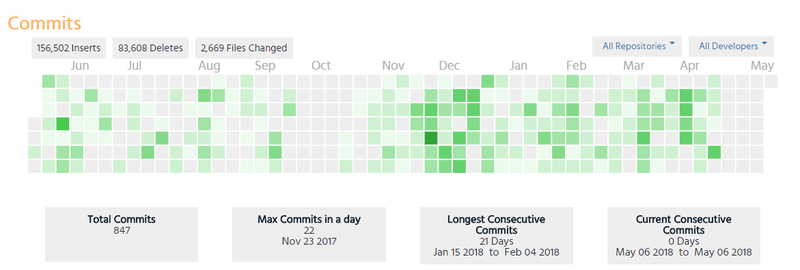
Get to the trends page by clicking on  on the left hand bar. Commits (heat map) chart displays the changes made to all or specific repository in terms of total number of new lines added (Inserts), number of lines deleted (Deletes) and number of files changed over a period of time by all or a specific developer.
Data specific to a repository and / or a developer can be selected from the drop down options available on the right hand side of the chart.

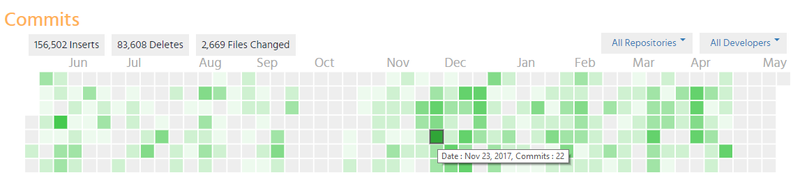
To view the commits on a particular day, hover over the pointer on the grid to view the tool tip with the desired details.
Based on the repositories and developers selected, the chart also displays additional statistics below the heat map. The timeframe considered is based on the selection made on the Trends page:
- Total commits - Total number of commits done in the selected timeframe (selected on Trends page)
- Max commits in a day - Displays the maximum number of commits done in a day in the selected timeframe
- Longest Consecutive Commits - Number of consecutive days with minimum one commit i.e. no day with zero commits
- Current Consecutive Commits - Consecutive commits w.r.t. today's date
| Panel | ||||||||||||
|---|---|---|---|---|---|---|---|---|---|---|---|---|
| ||||||||||||
Setting up Jira SoftwareStart a software projectSet up your software team |
| Panel | ||||||||||||
|---|---|---|---|---|---|---|---|---|---|---|---|---|
| ||||||||||||
The At A Glance Atlassian Community is here for you.Ask the community |
| Panel | ||||||||||||
|---|---|---|---|---|---|---|---|---|---|---|---|---|
| ||||||||||||
Open a support ticket |