/
Builds By Status and Average Duration of Builds
Builds By Status and Average Duration of Builds
- Sean Binny
Owned by Sean Binny
Last updated: Feb 26, 2018
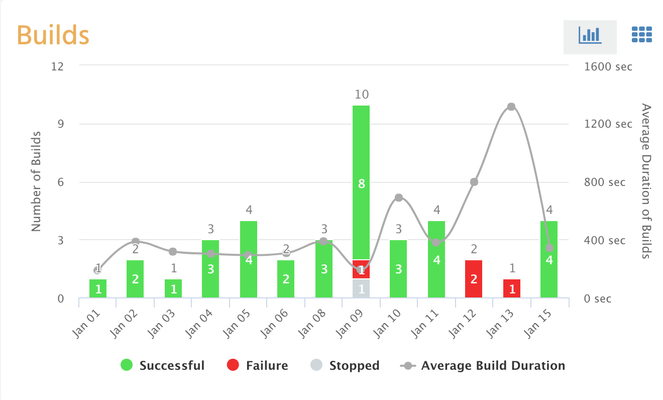
Builds By Status:
View all the builds in the current sprint or if no sprint is found then builds in the last 30 days can be viewed. In the builds widget click on the chart  icon to see the builds chart.
The X-Axis shows the date and time in the sprint or the last 30 days. The Y-Axis shows the number of builds. The second Y-Axis on the right shows the Average duration of builds. The colors on each bar show the status of the build:
Red - Shows Failed builds
Green - Shows Successful builds
Gray - Shows Stopped builds
Related Content
Engage in our community
The At A Glance Atlassian Community is here for you.
Ask the community
Still need help?
, multiple selections available,
Related content
Overview - Builds
Overview - Builds
More like this
Commits per day
Commits per day
More like this
Pull Requests per day
Pull Requests per day
More like this
Commits per developer
Commits per developer
More like this
Builds Grid view
Builds Grid view
More like this
Stories and Bugs - Chart - Epics and Components
Stories and Bugs - Chart - Epics and Components
More like this